-
Getting Started
-
Wearable
- Garmin Device Firmware Guide
- Check Garmin Device Firmware
- Set up and Connect Garmin Index2 Scale
- Screen Control on Garmin Wearables
- How to charge Garmin devices best
- Wearable and Device ID Management
- Setup: Prepare Wearable Devices
- Compatible Garmin Devices
- Garmin Timezone & Time
- Wifi Capabilities and Restrictions of Garmin Devices
- Screenless bands for blinded data collection
-
Setup
-
Manage
-
Data Collection
- Collect Data: Synchronization Types
- Collect Data: Tablet Sync (multi-sync) with "Fitrockr Hub (Multi-Sync)" app
- Collect Data: Smartphone Sync (single-sync) with Garmin Connect app
- Collect Data: Overview
- Collect Data: Smartphone Sync (single-sync) with Fitrockr app
- Collect Data: Sync via USB cable to Laptop
- Collect Data: Smartphone Sync (single-sync) with Omron Blood Pressure Monitors
- Apple Health and Google Health Connect
- Withings
- Wifi Capabilities and Restrictions of Garmin Devices
- Wearable Sync Methods and Frequencies
- Samsung Health
- Oura
- Polar
- Collect Data: Menstrual Cycle Tracking
- Screenless bands for blinded data collection
- Show all articles (1) Collapse Articles
-
Track
-
Analyze
- Analyze: Overview
- Analyze: Data Export
- Analyze: Standard Reports
- Analyze: Sleep Analysis
- Analyze: Vitality Report
- Analyze: 6 Minute Walk Test
- Analyze: Body Battery
- Analyze: HRV
- Analyze: Activities
- Analyze: Live Streaming
- Analyze: Analytics Studio
- Analyze: Share
- Setup: Onboarding & First Steps
- Analyze: Data Export (Accelerometer & Gyroscope)
-
Other
-
Trouble Shooting
-
Definitions
-
FAQ
- How to use HR monitor strap
- What happens when a Garmin device runs full?
- How to read Accelerometer json output file
- How to get access to Dexcom data
- Which Garmin devices support Wifi sync
- How to free up and reclaim licenses
- How to do a complete data export
- How to enable notifications on the wearable
- Why are some values longer than the given timeframe
- How to pair the Garmin Index Sleep Monitor
- How to get GPS data
- How to check if background sync is enabled
- What does influence sleep measurement and recording
- Why do HR and BBI measurements not fully align?
- What apps are needed to use Fitrockr?
- How to pair and operate the screen-free Garmin CIRQA band?
- Show all articles (1) Collapse Articles
-
Blog
Motion Intensity
Motion Intensity is one of many valuable and interesting data points provided by the Fitrockr platform. Motion Intensity can be found in the following exports:
– Motion Intensity (raw data values)
– Daily / Hourly / Detailed Health Log (aggregated data values)
Motion Intensity
Motion Intensity (which can be found on the “Motion Intensity” data export) is a numerical abstraction of low-level accelerometer data, provided for use in further analysis. Motion Intensity is calculated at minute-level granularity as a number between 0 and 7, with 0 being still and 7 being constant, sharp motion. Unlike steps, distance, or activity type, which take net movement into account, motion intensity will increase even if the user does not move in space. For instance, if a user were to jump up and down or fidget with a pencil they would not get credit for any distance, but their motion intensity scores for that monitoring period would increase. It is very common to see mid-range motion intensities even for sedentary epochs as most people do not sit still.
Max Motion Intensity
Max Motion Intensity (which can be found on the “Daily/Hourly/Detailed Intensity” data export) is the maximum motion intensity value found in its 15-min epoch range. Garmin data is often (but not always) based on a 15-min data epoch range.
The following example illustrates the logic:
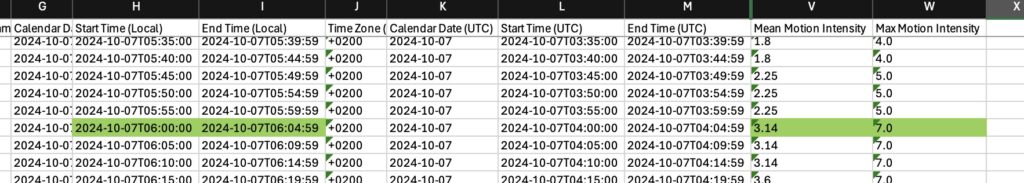
In this example, we are looking at the Detailed Health Log with an example data set ranging from 6:00:00 – 6:04:59. This timeframe falls into the 15-min epoch of 6:00 – 6:15. Looking up the raw motion intensity values for this 15-min epoch results in a maximum value of 7.
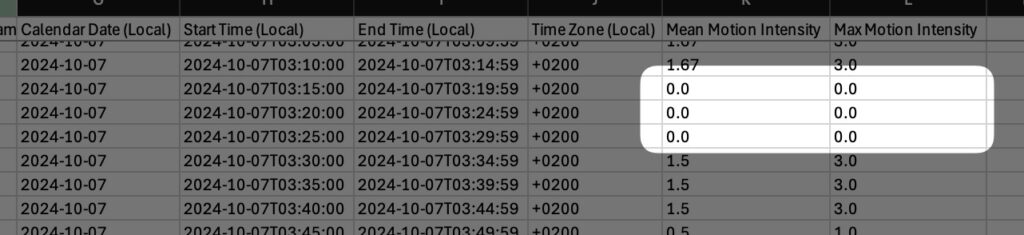
If a data set shows both, a Max Motion Intensity of 0 and a Mean Motion Intensity of 0, no raw data is available for calculation.
Mean Motion Intensity
Mean Motion Intensity (which can be found on the “Daily/Hourly/Detailed Intensity” data export) is the average motion intensity value found in its 15-min epoch range.
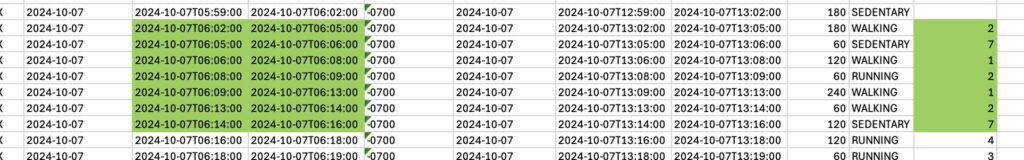
The following example illustrates the logic:
In this example, we are looking at the Detailed Health Log with an example data set ranging from 6:00:00 – 6:04:59. This timeframe falls into the 15-min epoch of 6:00 – 6:15. Looking up the raw motion intensity values for this 15-min epoch results in an average value of 3.14 [(2+7+1+2+1+2+7)7].
If a data set shows both, a Max Motion Intensity of 0 and a Mean Motion Intensity of 0, no raw data is available for calculation.