-
Getting Started
-
Garmin Devices
-
Setup
-
Manage
-
Data Collection
- Collect Data: Synchronization Types
- Collect Data: Tablet Sync (multi-sync) with "Fitrockr Hub (Multi-Sync)" app
- Collect Data: Smartphone Sync (single-sync) with Garmin Connect app
- Collect Data: Overview
- Collect Data: Smartphone Sync (single-sync) with Fitrockr app
- Collect Data: Sync via USB cable to Laptop
- Collect Data: Smartphone Sync (single-sync) with Omron Blood Pressure Monitors
-
Track
-
Analyze
-
Other
-
Trouble Shooting
-
Definitions
-
FAQ
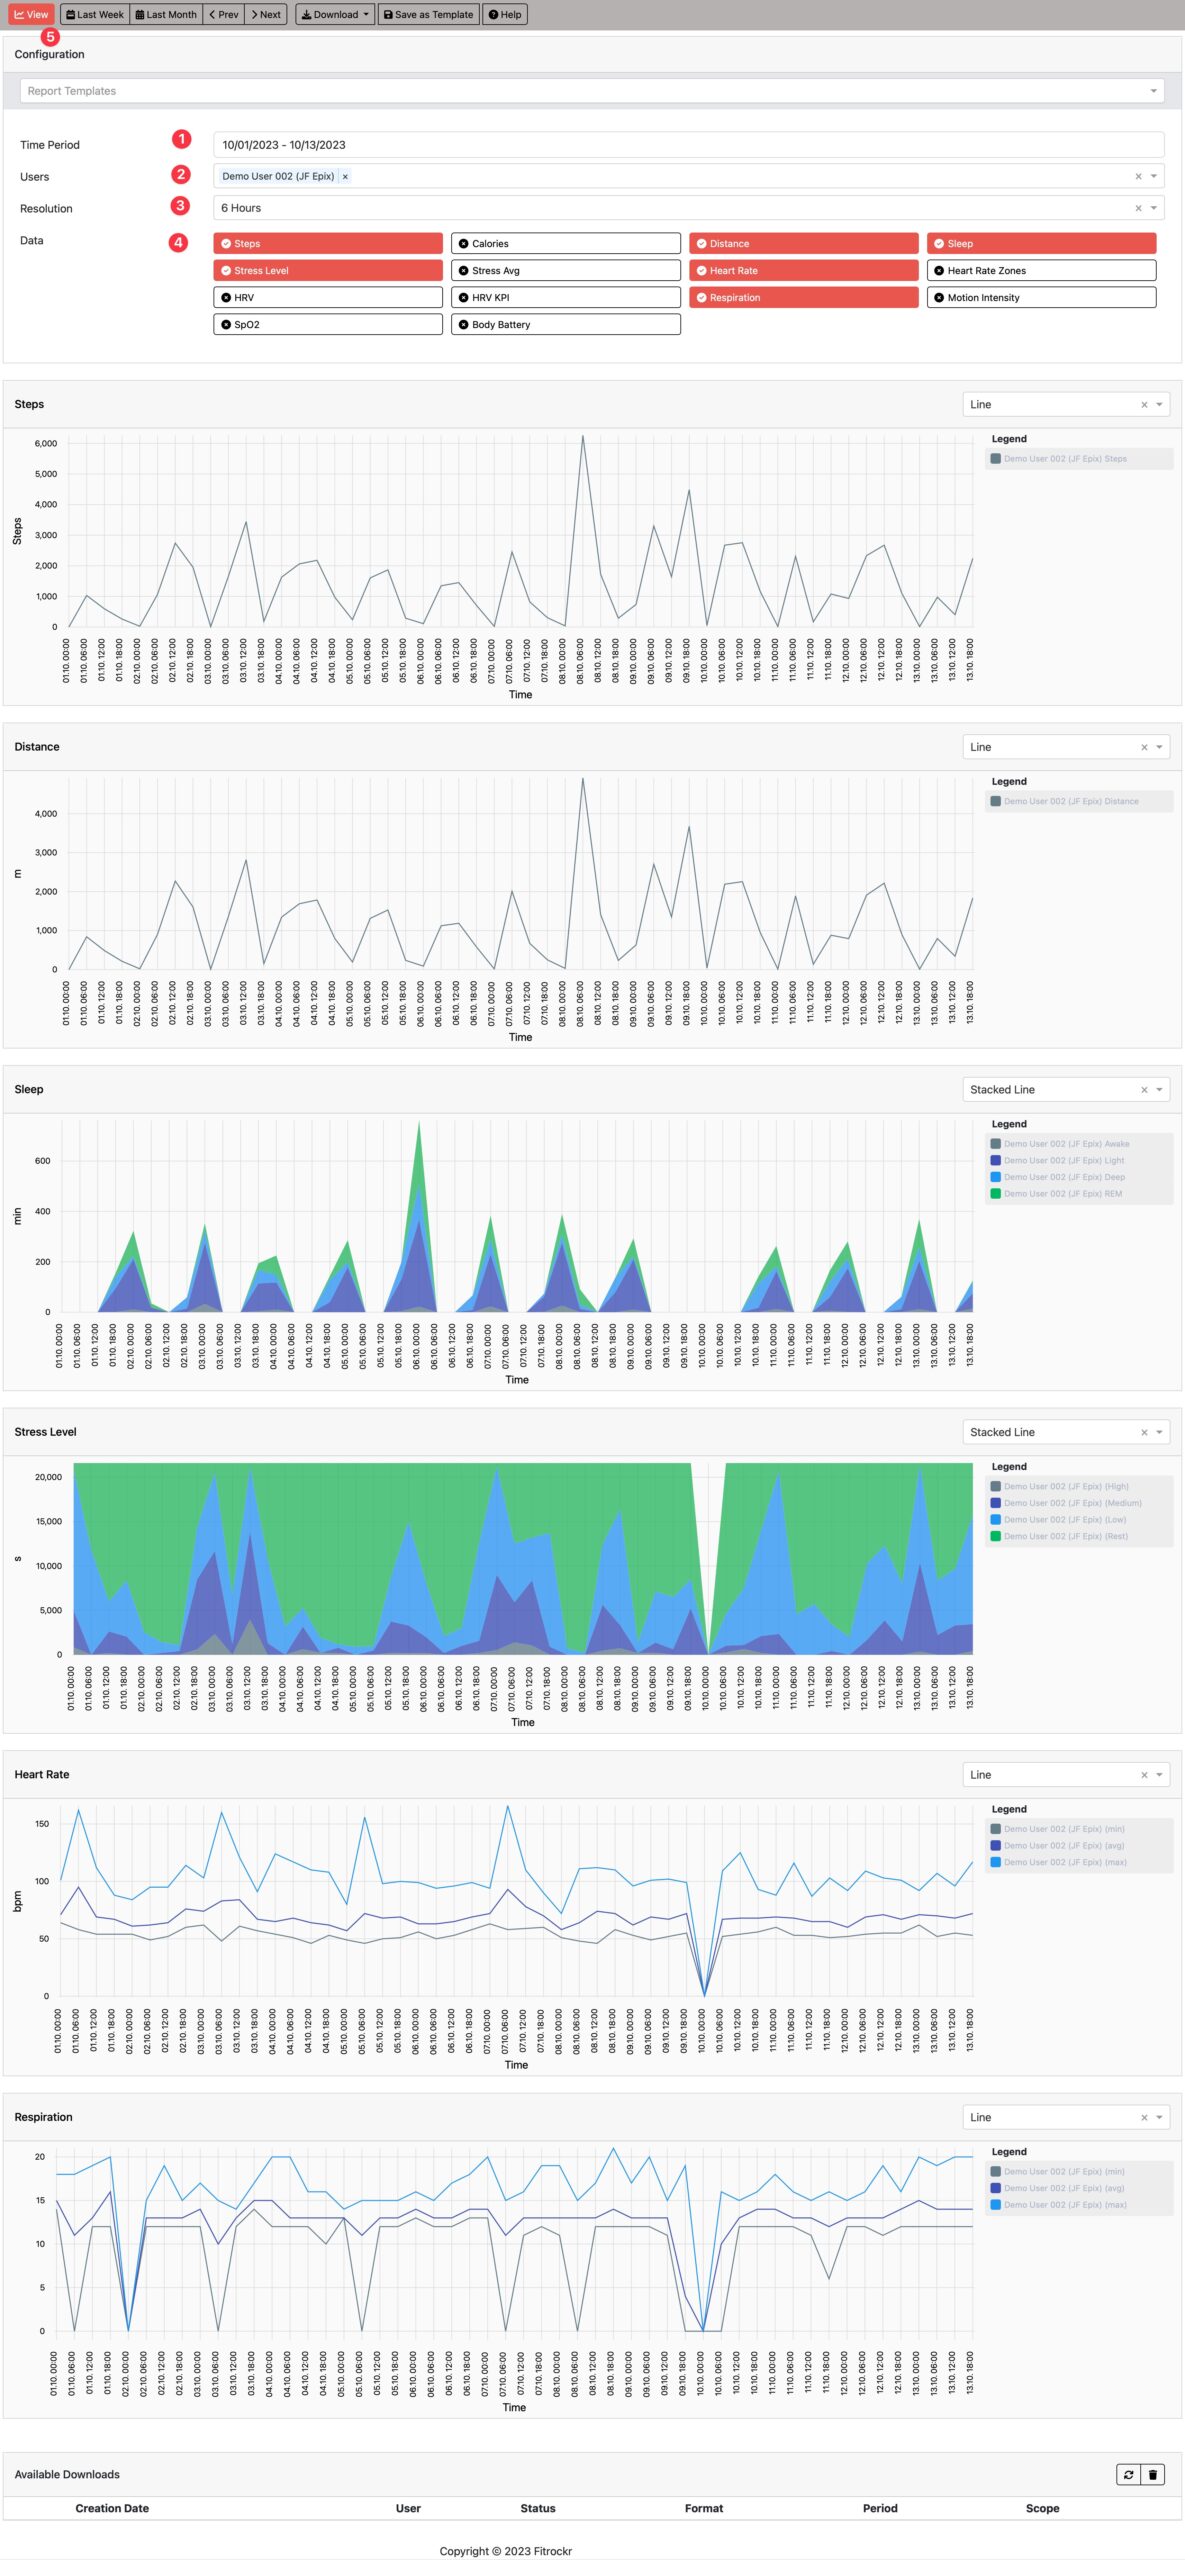
Analyze: Standard Reports
The Standard Reports module provides access to ready-made standard reports to analyze key health data. The report provides various charts, such as Steps, Calories, Distance, Sleep, Stress, Heart Rate, Heart Rate Zones, HRV, HRV Time Domain Respiration, Motion Intensity, SpO2, Body Battery, Skin Temperature, Accelerometer and Gyroscope on a daily and hourly resolution. Data can be viewed as line chart, stacked line chart, pie chart and will include minimum, average and maximum data.
(1) Select time period.
(2) Select user(s).
(3) Select resolution of data.
(4) Select data types.
(5) Click View to generate or refresh the diagram.
Highest resolution is 15mins if time period covers more than one day.
Set time period to one day to expand resolution to 1min increments. This is particularly useful for Accelerometer and Gyroscope.