Accelerometer & Gyroscope Data Plotting
Sep 11, 2024

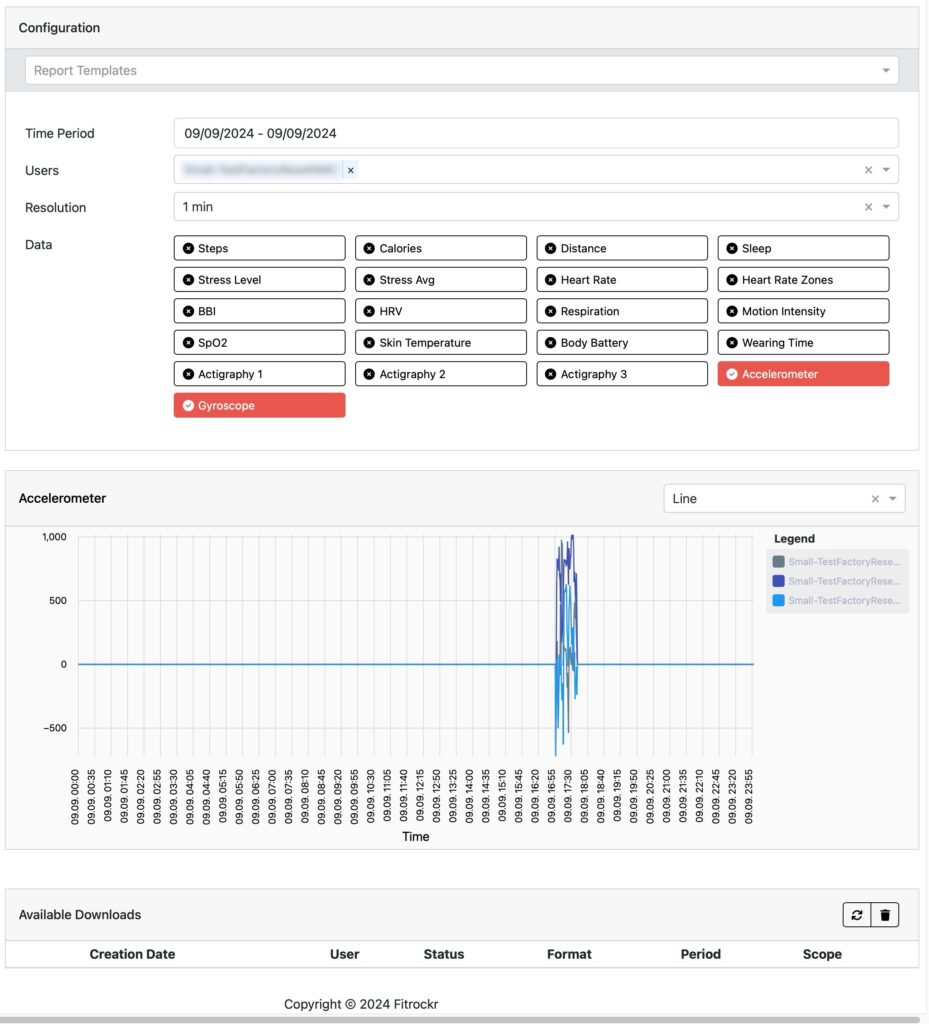
Accelerometer & Gyroscope data plotting is now available on the Fitrockr platform.
Accelerometer and gyroscope has been available for data collection and raw data export on Fitrockr since a long time. We have now added a visual data plotting functionality.
The accelerometer and gyroscope plot represents a graphical representation of data collected from both an accelerometer and a gyroscope device.
Accelerometer
– Measures: acceleration along 3 orthogonal axes (x, y and z). Data is recorded at 25Hz.
– Outputs: Garmin accelerometer sensor has a 10 bits/G resolution. The output to Fitrockr has been converted into milli-g units.
– Purpose: Detects linear motion, including tilt, movement, and vibration.
Gyroscope
– Measures: measures angular velocity along 3 orthogonal axes x, y and z. Data is recorded at
– Outputs: the unit of measurement is degrees/second.
– Purpose: Detects rotational motion and orientation changes.
Together, these plots give a detailed picture of the device’s movement, both in terms of its path through space (accelerometer) and how it is oriented or spinning (gyroscope).
The new plot has been added to the Fitrockr Standard Reports module.

The new functionality is available as a free upgrade to all platform subscriptions.

Fitrockr is a leading health and fitness data analytics platform that empowers organizations to connect, manage and analyze data from wearables. Designed for research, clinical studies, healthcare, coaching and fitness gamification, Fitrockr enables seamless integration of biometric and activity data, providing deep insights through advanced analytics, dashboards, reports and raw data downloads. Automated alerting, push notifications, surveys and outcome assessments support data collection. With a focus on data privacy, security, and local hosting options, Fitrockr supports global institutions in transforming raw health data into actionable outcomes. Learn more at www.fitrockr.com.
© Digital Rebels GmbH. All Rights Reserved.